Are the New York Yankees still the most winning Dynasty?
sports
data
MLB
Author
Koy Jorgenson
Published
April 12, 2024
MLB baseball has been around for centuries. Over the years there have been great teams throughout each generation with certain dynasties taking over. The New York Yankees have been one of those teams over the years who have just signed amazing players that have helped them win so many championships. Along with that, they played very consistently over the span of the last century.
Now looking at the modern generation one can ponder whether the Yankees have still dominated in the 2000s or whether there has been a more consistent organization over the past 23 years.
In fact, right now the MLB has the best players and the most difficult league that it has ever had.
Baseball Reference gives us data from every organization ever and the MLB total wins. Although simplifying this only to the years 2000 to 2023 so it is easier to understand.
Looking at the MLB now, do we have a different successful organization let’s look?
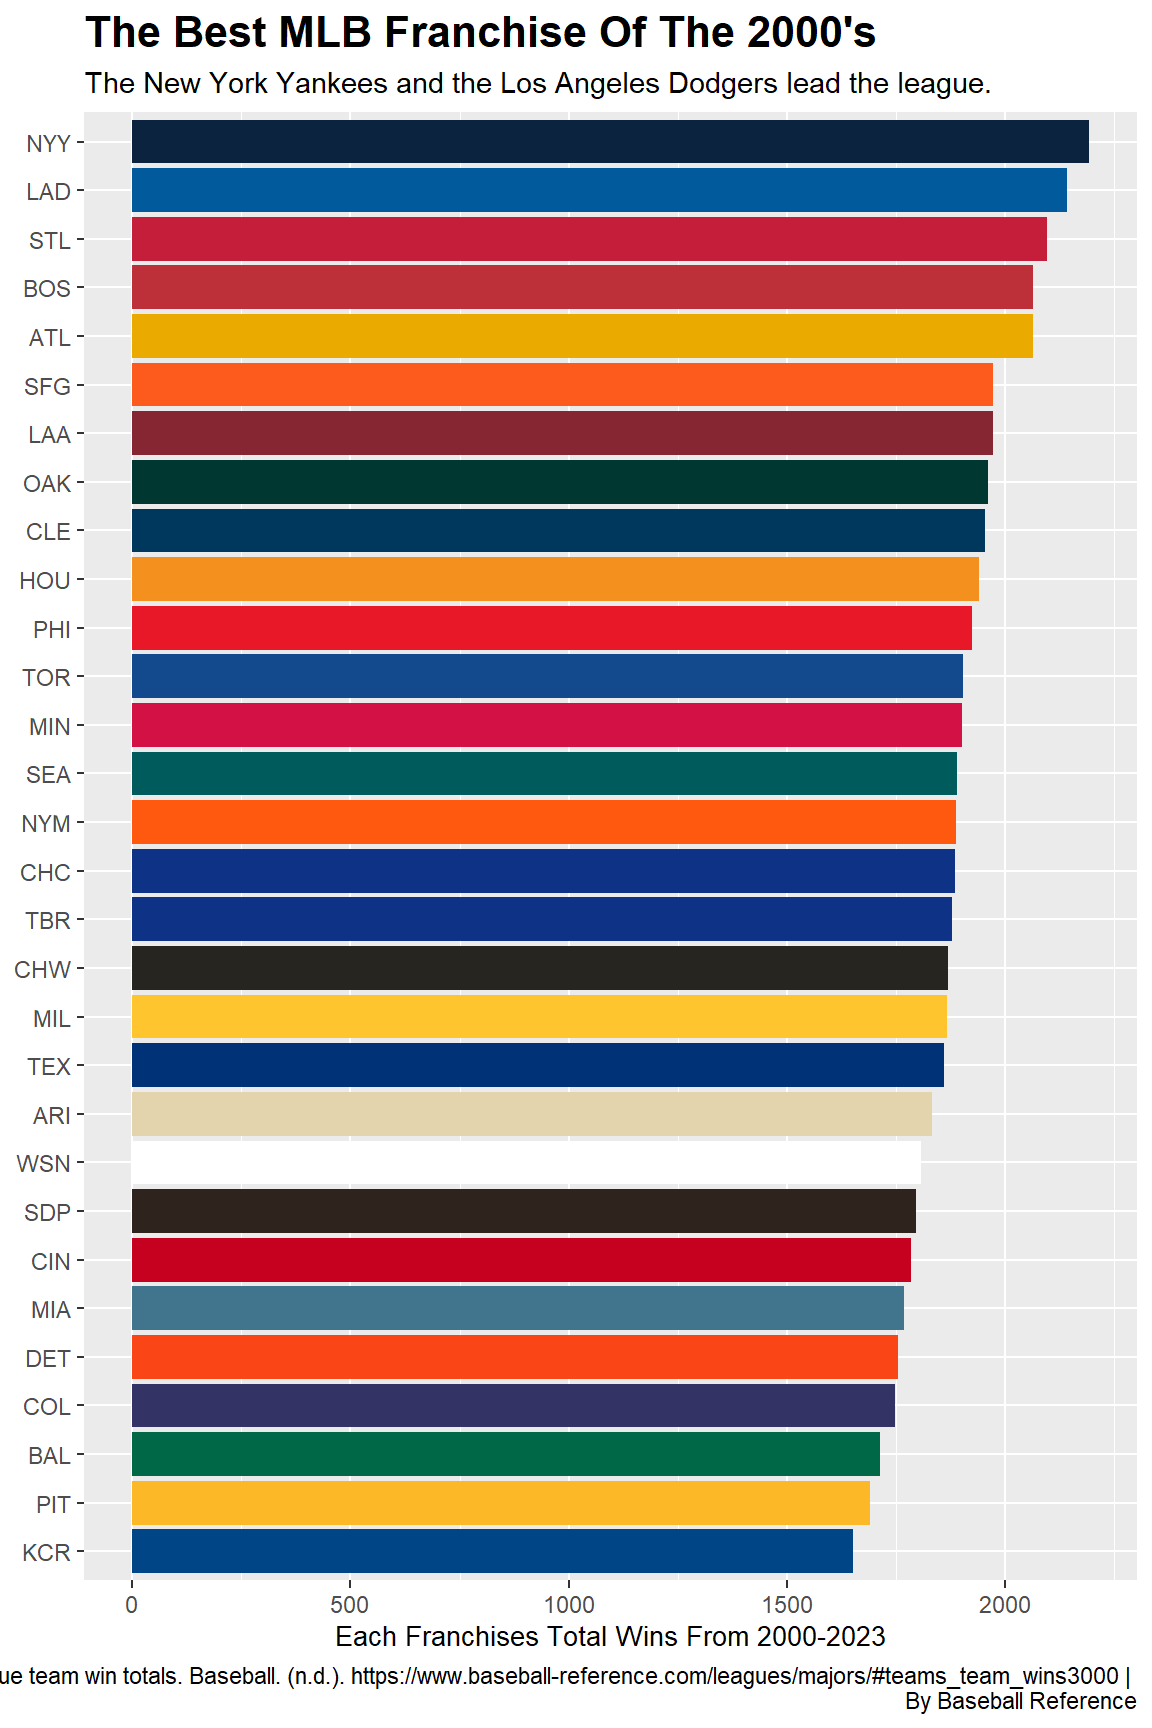
NYY <- Wins |>filter( Year =="NYY" )LAD <- Wins |>filter( Year =="LAD" )STL <- Wins |>filter( Year =="STL" )BOS <- Wins |>filter( Year =="BOS" )ATL <- Wins |>filter( Year =="ATL" )SFG <- Wins |>filter( Year =="SFG" )LAA <- Wins |>filter( Year =="LAA" )OAK <- Wins |>filter( Year =="OAK" )CLE <- Wins |>filter( Year =="CLE" )HOU <- Wins |>filter( Year =="HOU" )PHI <- Wins |>filter( Year =="PHI" )TOR <- Wins |>filter( Year =="TOR" )MIN <- Wins |>filter( Year =="MIN" )SEA <- Wins |>filter( Year =="SEA" )NYM <- Wins |>filter( Year =="NYM" )CHC <- Wins |>filter( Year =="CHC" )TBR <- Wins |>filter( Year =="TBR" )CHW <- Wins |>filter( Year =="CHW" )MIL <- Wins |>filter( Year =="MIL" )TEX <- Wins |>filter( Year =="TEX" )ARI <- Wins |>filter( Year =="ARI" )WSN <- Wins |>filter( Year =="WSN" )SDP <- Wins |>filter( Year =="SDP" )CIN <- Wins |>filter( Year =="CIN" )MIA <- Wins |>filter( Year =="MIA" )DET <- Wins |>filter( Year =="DET" )COL <- Wins |>filter( Year =="COL" )BAL <- Wins |>filter( Year =="BAL" )PIT <- Wins |>filter( Year =="PIT" )KCR <- Wins |>filter( Year =="KCR" )ggplot() +geom_bar(data=Wins, aes(x=reorder(Year, TotalWins), weight=TotalWins)) +geom_bar(data=NYY, aes(x=reorder(Year, TotalWins), weight=TotalWins), fill="#0C2340") +geom_bar(data=LAD, aes(x=reorder(Year, TotalWins), weight=TotalWins), fill="#005A9C") +geom_bar(data=STL, aes(x=reorder(Year, TotalWins), weight=TotalWins), fill="#C41E3A") +geom_bar(data=BOS, aes(x=reorder(Year, TotalWins), weight=TotalWins), fill="#BD3039") +geom_bar(data=ATL, aes(x=reorder(Year, TotalWins), weight=TotalWins), fill="#EAAA00") +geom_bar(data=SFG, aes(x=reorder(Year, TotalWins), weight=TotalWins), fill="#FD5A1E") +geom_bar(data=LAA, aes(x=reorder(Year, TotalWins), weight=TotalWins), fill="#862633") +geom_bar(data=OAK, aes(x=reorder(Year, TotalWins), weight=TotalWins), fill="#003831") +geom_bar(data=CLE, aes(x=reorder(Year, TotalWins), weight=TotalWins), fill="#00385D") +geom_bar(data=HOU, aes(x=reorder(Year, TotalWins), weight=TotalWins), fill="#F4911E") +geom_bar(data=PHI, aes(x=reorder(Year, TotalWins), weight=TotalWins), fill="#E81828") +geom_bar(data=TOR, aes(x=reorder(Year, TotalWins), weight=TotalWins), fill="#134A8E") +geom_bar(data=MIN, aes(x=reorder(Year, TotalWins), weight=TotalWins), fill="#D31145") +geom_bar(data=SEA, aes(x=reorder(Year, TotalWins), weight=TotalWins), fill="#005C5C") +geom_bar(data=NYM, aes(x=reorder(Year, TotalWins), weight=TotalWins), fill="#FF5910") +geom_bar(data=CHC, aes(x=reorder(Year, TotalWins), weight=TotalWins), fill="#0E3386") +geom_bar(data=TBR, aes(x=reorder(Year, TotalWins), weight=TotalWins), fill="#0E3386") +geom_bar(data=CHW, aes(x=reorder(Year, TotalWins), weight=TotalWins), fill="#27251F") +geom_bar(data=MIL, aes(x=reorder(Year, TotalWins), weight=TotalWins), fill="#FFC52F") +geom_bar(data=TEX, aes(x=reorder(Year, TotalWins), weight=TotalWins), fill="#003278") +geom_bar(data=ARI, aes(x=reorder(Year, TotalWins), weight=TotalWins), fill="#E3D4AD") +geom_bar(data=WSN, aes(x=reorder(Year, TotalWins), weight=TotalWins), fill="#FFFFFF") +geom_bar(data=SDP, aes(x=reorder(Year, TotalWins), weight=TotalWins), fill="#2F241D") +geom_bar(data=CIN, aes(x=reorder(Year, TotalWins), weight=TotalWins), fill="#C6011F") +geom_bar(data=MIA, aes(x=reorder(Year, TotalWins), weight=TotalWins), fill="#41748D") +geom_bar(data=DET, aes(x=reorder(Year, TotalWins), weight=TotalWins), fill="#FA4616") +geom_bar(data=COL, aes(x=reorder(Year, TotalWins), weight=TotalWins), fill="#333366") +geom_bar(data=BAL, aes(x=reorder(Year, TotalWins), weight=TotalWins), fill="#006747") +geom_bar(data=PIT, aes(x=reorder(Year, TotalWins), weight=TotalWins), fill="#FDB827") +geom_bar(data=KCR, aes(x=reorder(Year, TotalWins), weight=TotalWins), fill="#004687") +coord_flip() +labs(x="Every MLB Franchise", y="Each Franchises Total Wins From 2000-2023", title="The Best MLB Franchise Of The 2000's", subtitle="The New York Yankees and the Los Angeles Dodgers lead the league.", caption="Source: Major League team win totals. Baseball. (n.d.). https://www.baseball-reference.com/leagues/majors/#teams_team_wins3000 | By Baseball Reference", ) +theme(plot.title =element_text(size =16, face ="bold"),axis.title =element_text(size =10),axis.title.y =element_blank(),)
The Yankees and the Dodgers lead the way with the most wins of the 2000s, at 2,192 and 2,141 as the two most consistent franchises of the modern generation.
With the Yankees leading the way another thing that is important to know is who average is the most wins per season on average. This is so we can better know who the most consistent franchise is of today.
Code
AverageWinsPer <- Wins|>mutate(AverageWinsPerSeason = TotalWins/23 )EachFranchisesWins <- AverageWinsPer |>select(Year, TotalWins, AverageWinsPerSeason)EachFranchisesWins |>gt() |>cols_label(Year ="Franchise",TotalWins ="TotalWins",AverageWinsPerSeason ="AverageWinsPerSeason" ) |>tab_header(title ="Are the New York Yankees the most consistent franchise of the modern generation?",subtitle ="The New York Yankees lead the league with 2,192 wins and 95 wins on average per season." ) |>tab_style(style =cell_text(color ="black", weight ="bold", align ="left"),locations =cells_title("title") ) |>tab_style(style =cell_text(color ="black", align ="left"),locations =cells_title("subtitle") ) |>tab_source_note(source_note =md("**By:** Koy Jorgenson | **Source:** Baseball Reference: Consisting of MLB Baseball Win Stats.") ) |>tab_style(locations =cells_column_labels(columns =everything()),style =list(cell_borders(sides ="bottom", weight =px(3)),cell_text(weight ="bold", size=15) )) |>opt_row_striping() |>opt_table_lines("none")
Are the New York Yankees the most consistent franchise of the modern generation?
The New York Yankees lead the league with 2,192 wins and 95 wins on average per season.
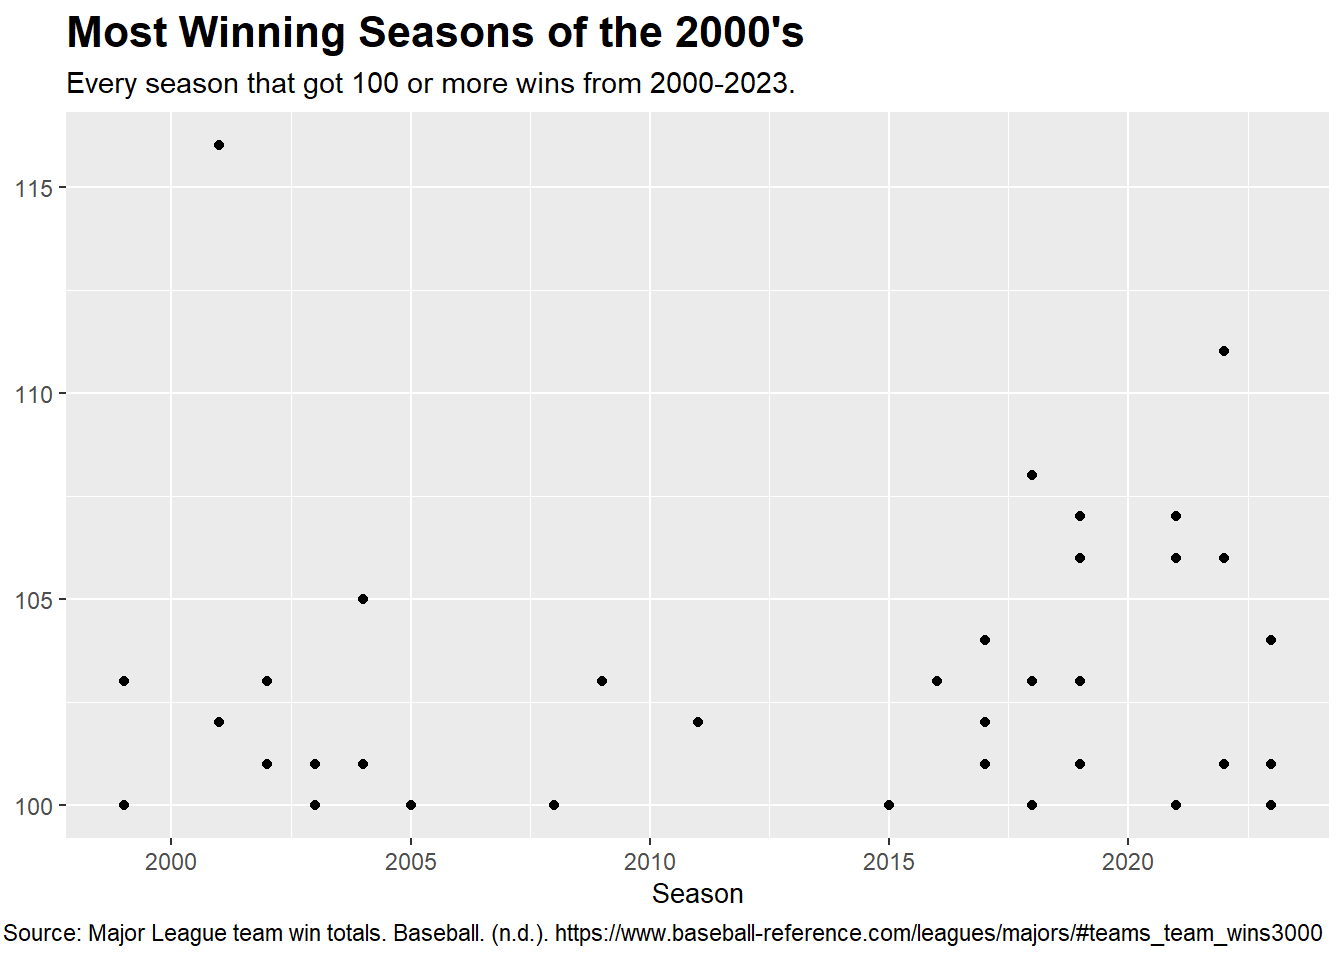
Looking at the most successful seasons, who has the most wins in a single season in the modern era?
The graph below consists of teams with the most wins in a single season.
Code
MoreThan100 <- LongData |>filter(Wins >=100) |>arrange(desc(Wins))ggplot() +geom_point(data=MoreThan100, aes(x=Year, y=Wins)) +labs(x="Season", y="Wins", title="Most Winning Seasons of the 2000's", subtitle="Every season that got 100 or more wins from 2000-2023.", caption="Source: Major League team win totals. Baseball. (n.d.). https://www.baseball-reference.com/leagues/majors/#teams_team_wins3000 " ) +theme(plot.title =element_text(size =16, face ="bold"),axis.title =element_text(size =10),axis.title.y =element_blank())
Learning from this data and the graphs it is demonstrated that these are very in depth on who is the most successful team. It will be interesting to see where the next 20 years take us with Major League Baseball and which franchises will have the most successful seasons.